
By Gary Aiken | October 8, 2026
In the 19th and 20th centuries, coal miners carried caged canaries into underground tunnels. Canaries have fast, sensitive respiratory systems. They succumb to toxic, odorless gases like carbon monoxide and methane much faster than humans. If the bird became sick, stopped singing, or died, it gave miners immediate notice to evacuate before the air became lethal to the miners. In a similar way, high yield bond spreads have been seen by many investors as a canary – a harbinger of potential market stress to come.
Bonds are rated on a scale from AAA (the best) to AA, A, and then to BBB. This range of ratings is known as investment grade. They can be held in an almost unlimited way by banks, pension funds, and insurance companies because their historical default rates are low. Ratings from BB through CCC are considered high yield, or “junk,” bonds. Junk bonds have lower ratings for many reasons. The companies are smaller, their debt levels are high, their balance sheets are weaker, their earnings less predictable, and risks to the underlying business are serious. This isn’t to say that junk bonds are all built the same, or that we shouldn’t invest in them. On the contrary, active bond management using high yield bonds can add tremendous value – buying distressed bonds at a significant discount when a deeper analysis shows a higher chance of the business recovering and the debt maturing at par.
At the same time, the prices of these bonds are distressed for a reason. But understanding the reason is important. For the purposes of this month’s insight, where we will not be examining individual credits, there are two main explanations.
One is that there is a structural component to the junk bond market, especially to CCC-rated bonds. Many funds including Collateralized Loan Obligations (CLOs) and insurance companies whose regulators require a substantial amount of capital per lower rated bond choose to hold very few of the lowest rated bonds. Some even have investment policies that force sales when a bond’s rating declines to CCC. So, as lower rated bonds and loans move from BB to B to CCC, the number of holders structurally gets smaller forcing the price lower to entice someone to buy debt that has few natural buyers. We have heard from some managers of CLOs that this forced selling and/or purchase prohibition is the phenomenon responsible for some recent price action in CCC spreads.
A second, more ominous explanation is that the culprit for falling prices of CCC bonds (their yields are rising) is worsening economic conditions. CCC-rated companies are the most susceptible to a deteriorating business environment – they have very little margin for error before they cannot find a lender to refinance their debts or even make interest payments. They are only one bad news story away from default. More companies moving down the credit ladder while spreads widen could be that canary.
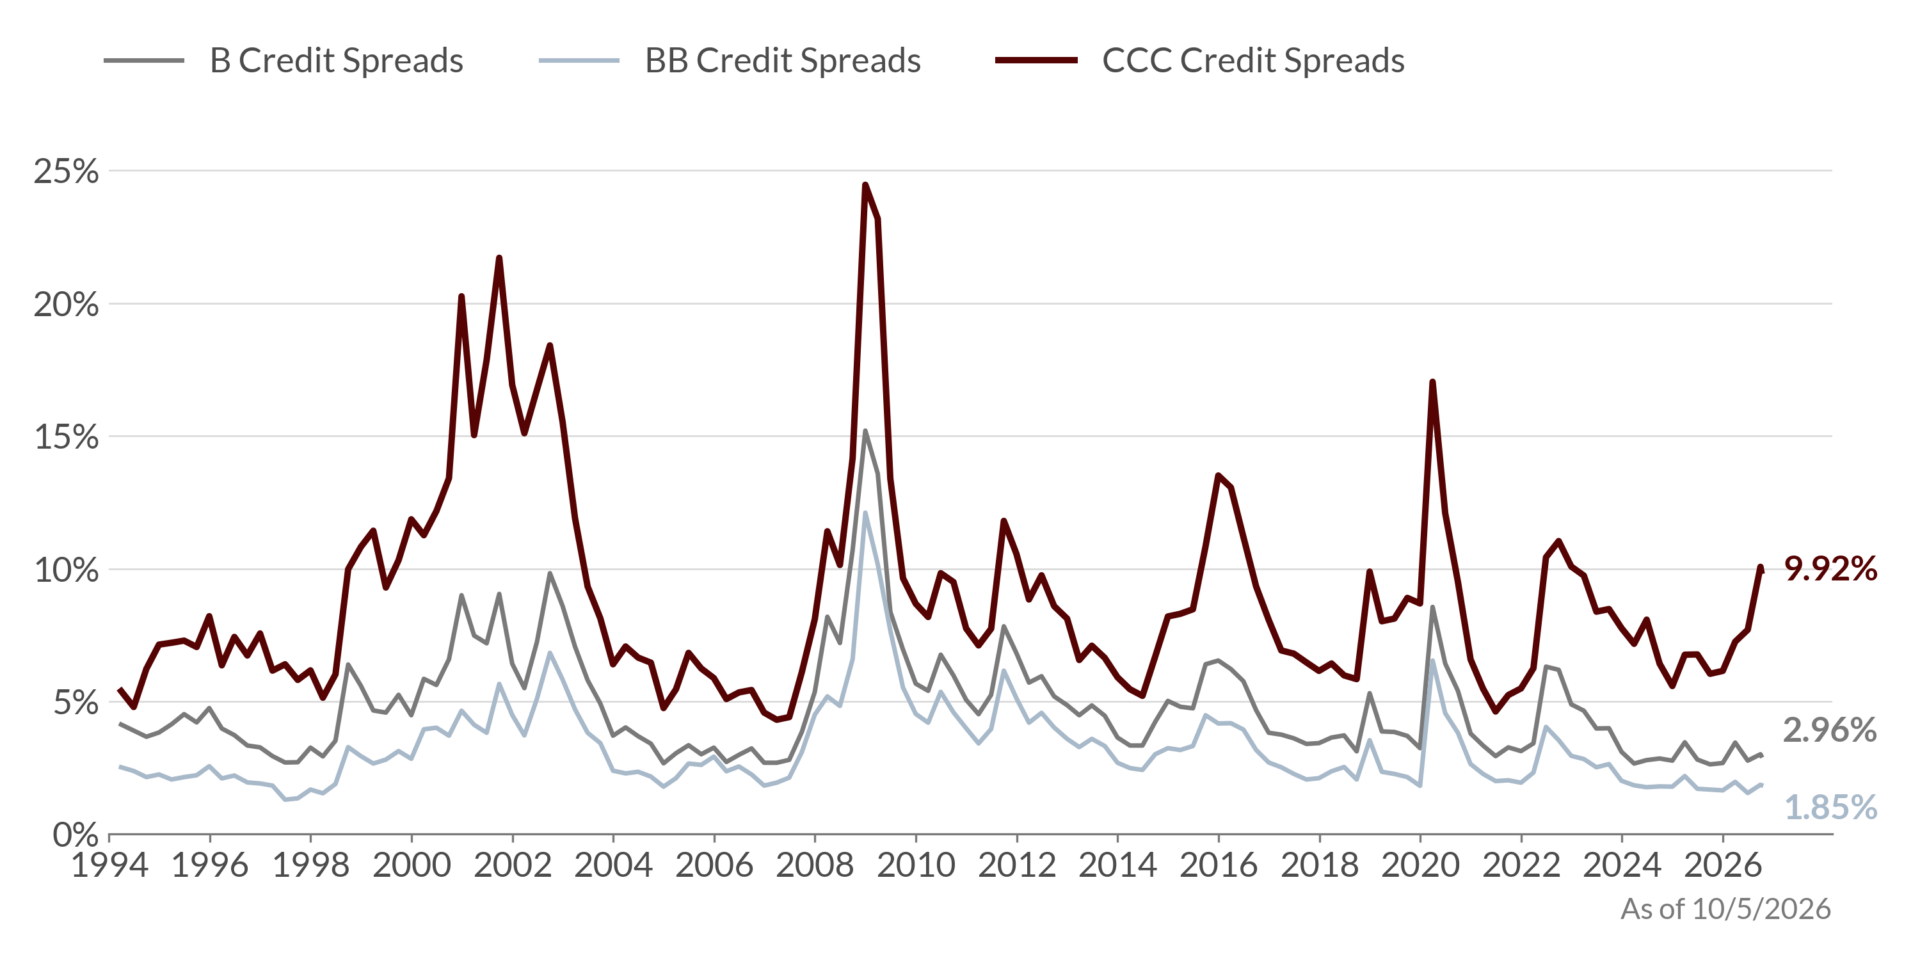
And so, we get to our Chart of the Month. This month we’re looking at the credit spreads (the amount of yield above default risk-free Treasury bonds) required by the market. The chart shows the spreads of BB- (the highest rated junk bonds), B-, and CCC- (the lowest rated junk bonds) rated bonds. We should note that CCC spreads are now roughly 1,000 basis points (10%) above Treasuries. That means the average 2-year CCC bond yields 4.8% (the 2-year Treasury yield) plus a 10% credit spread for a total 14.8% yield to maturity.
Credit Spreads for US Junk Bonds
Source: Bloomberg Finance, LP
You might be enticed by this spread – after all – 14.8% is a great return. Of course, you haven’t added in the fact that many of those bonds will go into default, go through a recovery, and you are not likely to get all your money back. But let’s attack the canary issue. Does a 1,000 basis point spread in CCCs mean an economic calamity or a stock market catastrophe is on the way?
Examining the last 32 years, when CCCs breach the 1,000 basis point threshold, the subsequent junk bond returns over the next 3 months, 6 months, and year were varied. A negative return on junk bonds reflects prices decreasing so much that the change in price overwhelms the higher coupon income earned by bondholders or reflects significant defaults (price declines and no interest received). A flat return means that although prices declined, interest payments delivered offsetting dollars.
Without a recession, the stock market (S&P 500 Index) generally powered through a tough spell for junk bonds. Returns to stocks and junk bonds were mostly positive in the months and year after the spread spikes in 1998, 2011, and 2015. Junk bond returns in 2015 reflected an energy industry concentration. Many junk bond issuers in the energy industry defaulted as the price of oil and natural gas fell dramatically with the expansion of fracking. Still, a year later junk bonds and stocks ended with positive total returns.
When recessions materialized, junk bonds made negative returns (2000 and 2008) for most of the studied periods. In 2000, the stock market continued to rise through August, before the dotcom bust drove stocks materially lower. In 2008, CCC bonds breached the 1,000 basis point mark about 2 months before the collapse of Bear Stearns and the six month and year periods thereafter were significantly negative as the Great Financial Crisis spiraled.
So, perhaps CCC spreads can be considered as a canary in the coal mine. If they have any predictive canary power, the limited history here suggests that we should have 3 to 6 months before significant problems in other markets materialize. We have been talking about risk and mitigation strategies in these Insight pages for a couple of months now. We should not put our head in the sand like an ostrich. The canary is the bird providing another puzzle piece in the macroeconomic mosaic.
Author

Gary Aiken
Chief Investment Officer
Concord Asset Management
Gary Aiken is the Chief Investment Officer for Concord Asset Management and is responsible for macroeconomic analysis, asset allocation, and security selection, as well as trading and investment operations.
Gary has over 23 years of investment experience and holds an undergraduate degree in economics from the University of Maryland and an MBA from The George Washington University School of Business.
—
Please remember that past performance may not be indicative of future results. Different types of investments involve varying degrees of risk, and there can be no assurance that the future performance of any specific investment, investment strategy, or product, including the investments and/or investment strategies recommended or undertaken by Concord Asset Management, or any non-investment related content made reference to directly or indirectly in this article, will be profitable, equal any corresponding indicated historical performance level(s), be suitable for your portfolio or individual situation, or prove successful. This content is provided for informational and educational purposes only and should not be construed as personalized investment, legal, tax, or accounting advice. Any forward-looking statements, opinions, or projections expressed herein are based on information available at the time of publication and are not guarantees, predictions, or assurances of future events, performance, or results. Actual outcomes may differ materially due to market conditions, economic developments, regulatory changes, changes in applicable laws or regulations, and other factors.
Due to various factors, including changing market conditions and/or applicable laws, the content may no longer be reflective of current opinions or positions. Moreover, you should not assume that any discussion or information contained in this article serves as the receipt of, or as a substitute for, personalized investment advice from Concord Asset Management. To the extent that a reader has any questions regarding the applicability of any specific issue discussed above to his/her individual situation, he/she is encouraged to consult with the professional advisor of his/her choosing.
Concord Asset Management is neither a law firm nor a certified public accounting firm, and no portion of this content should be construed as legal or accounting advice. A copy of Concord Asset Management’s current written disclosure Brochure discussing our advisory services and fees is available upon request or at www.concordassetmgmt.com. Please Note: If you are a Concord Asset Management or Concord Wealth Partners client, please remember to contact the firm in writing if there are any changes in your personal/financial situation or investment objectives for the purpose of reviewing, evaluating, and/or revising our previous recommendations and/or services, or if you would like to impose, add, or modify any reasonable restrictions to our investment advisory services. Concord Asset Management and Concord Wealth Partners shall continue to rely on the accuracy of information that you have provided.
Please Note: If you are a Concord Asset Management or Concord Wealth Partners client, please advise us if you have not been receiving account statements, at least quarterly, from the account custodian.