By Gary Aiken | June 6, 2024
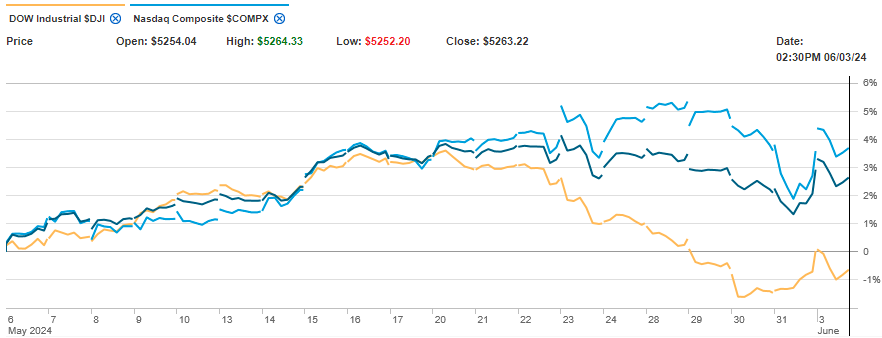
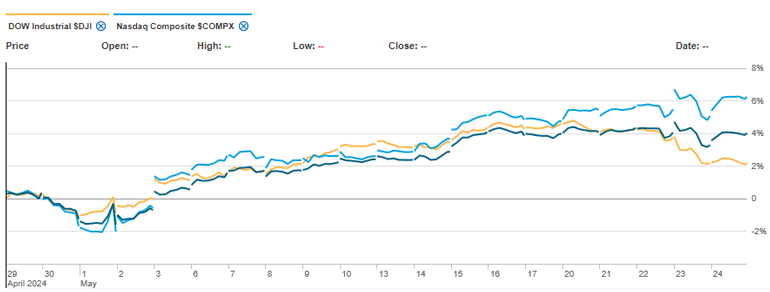
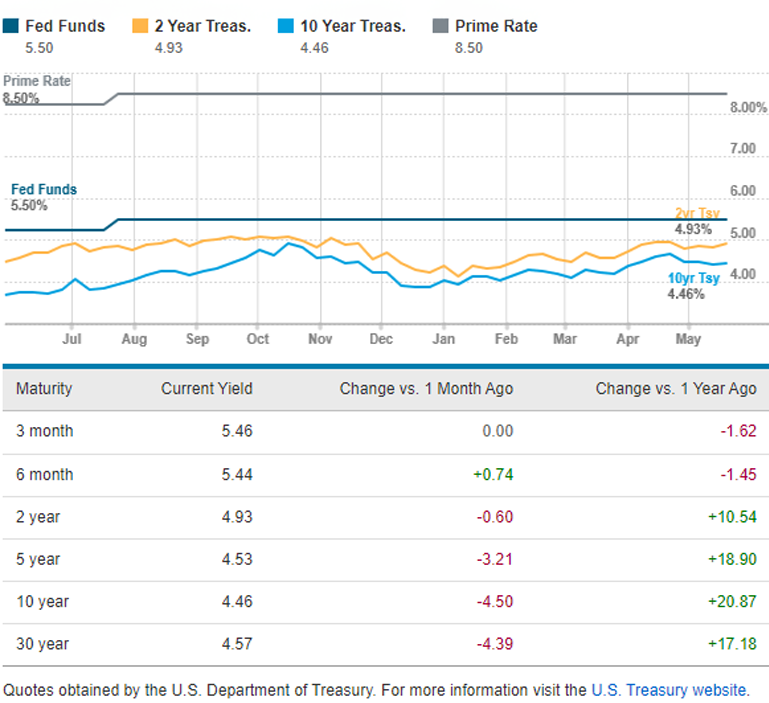
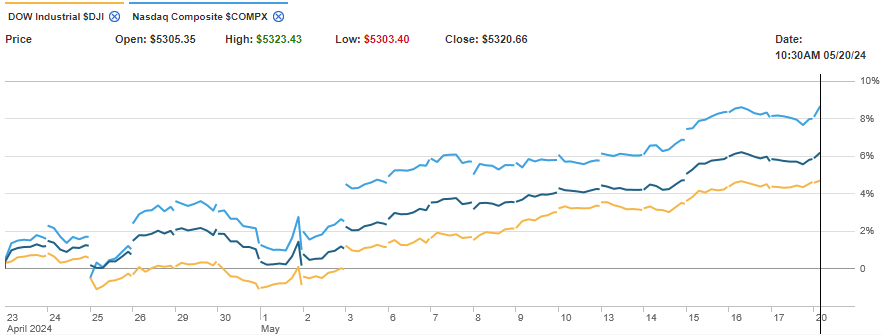
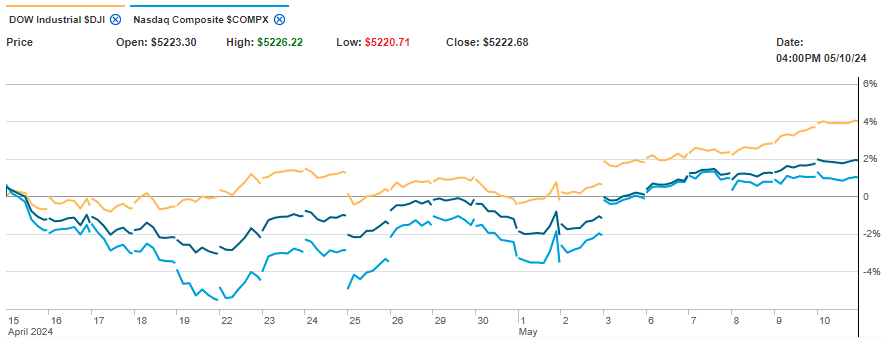
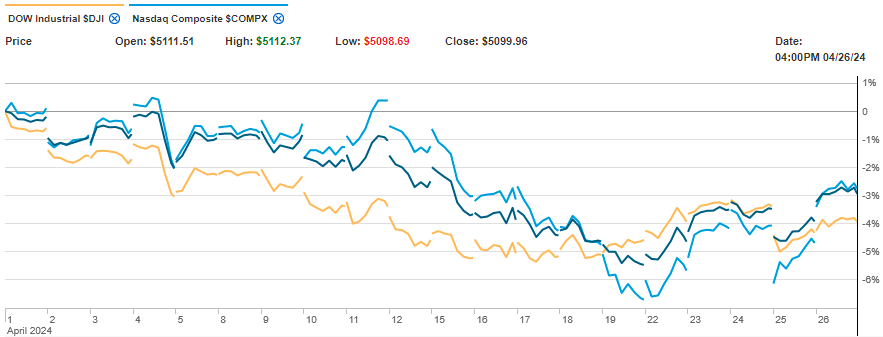
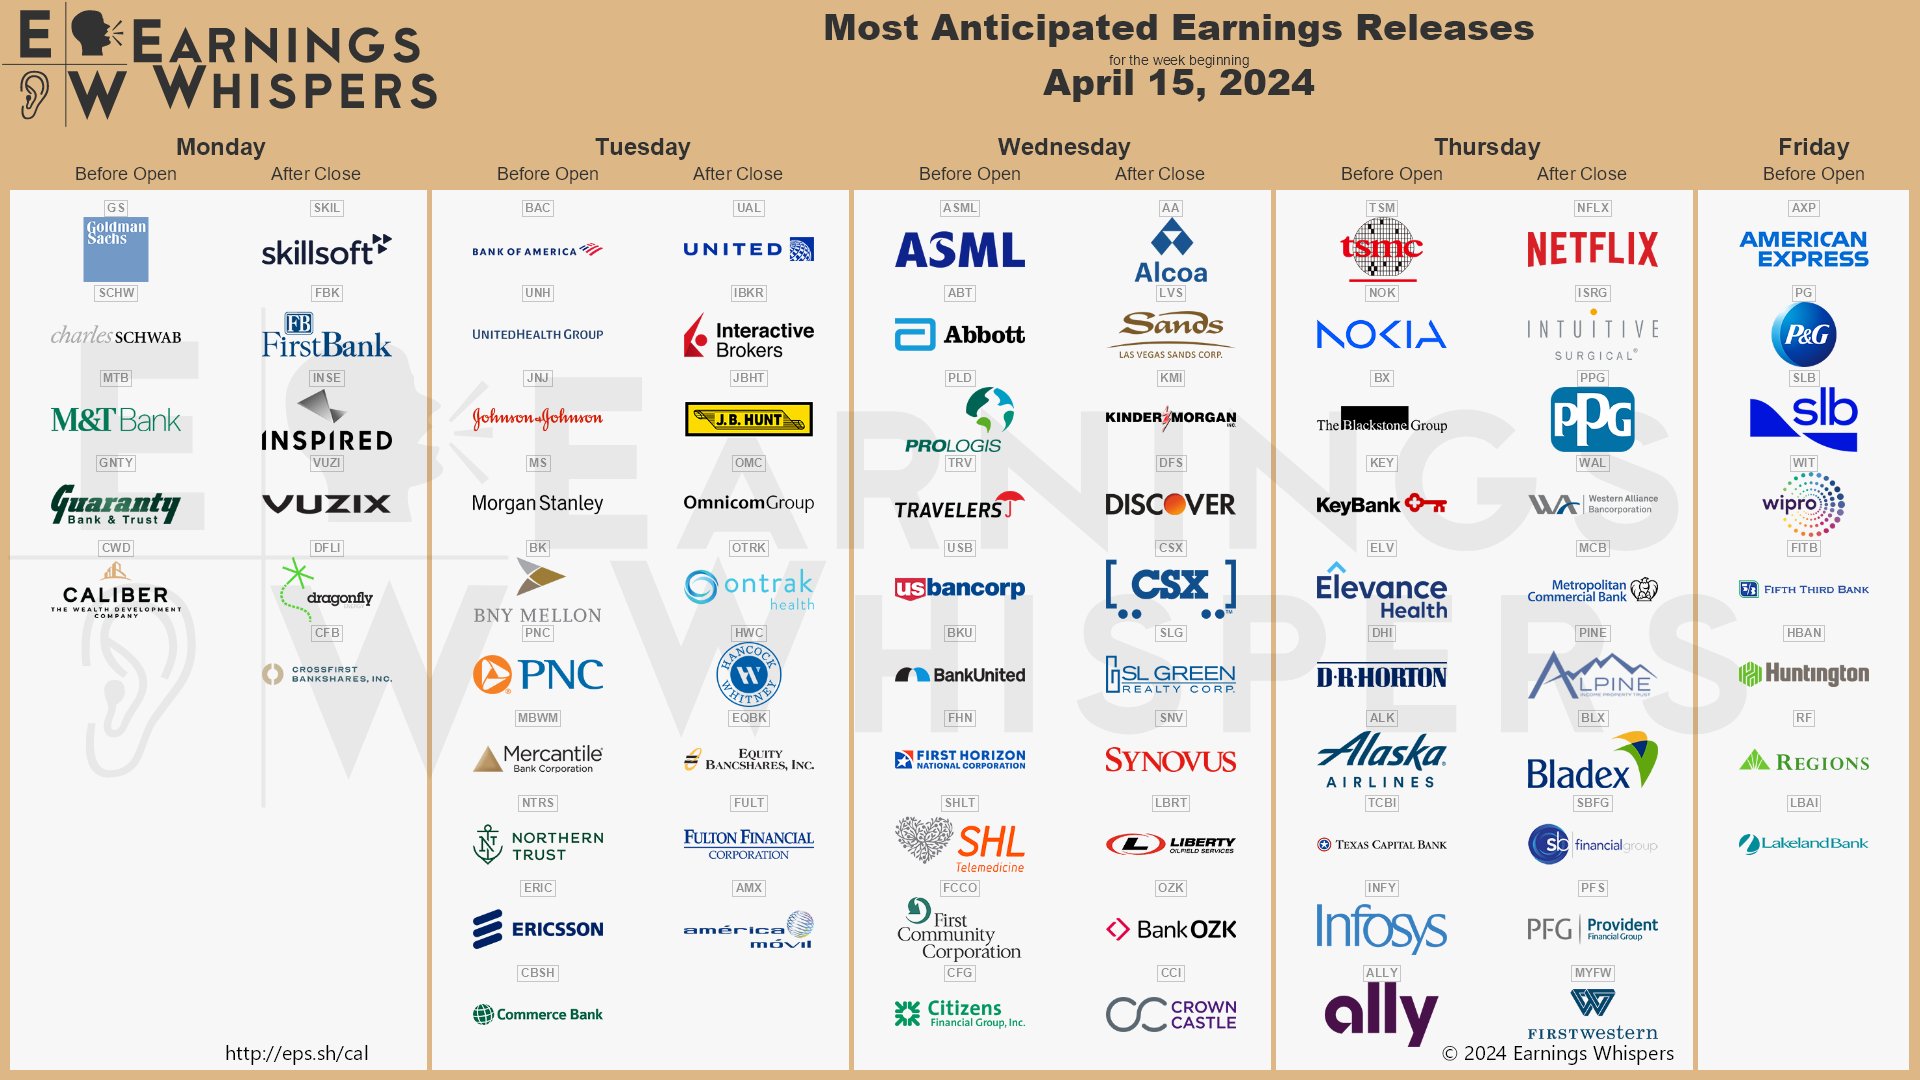
May was a good month for U.S. stocks. Earnings reports continued to roll in, showing corporate profits increasing at an 8-10% pace year over year. Concurrently, slightly lower long-term bond yields led to an expansion in the price-to-earnings multiple for U.S. stocks. Still, underlying concerns have been simmering beneath the surface for some time. I believe these concerns might resurface, causing short-term unease among investors and long-term implications for citizens.
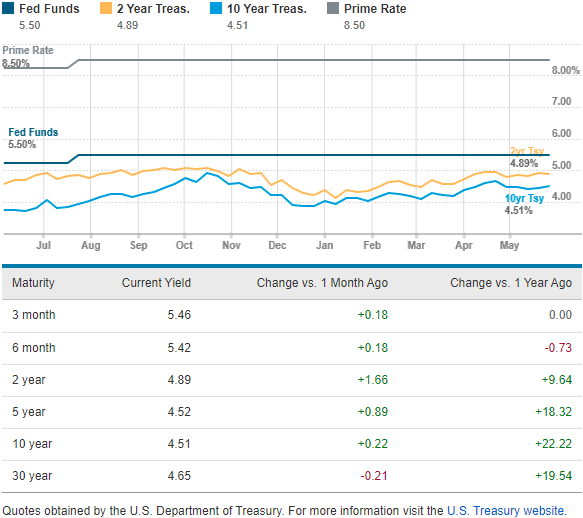
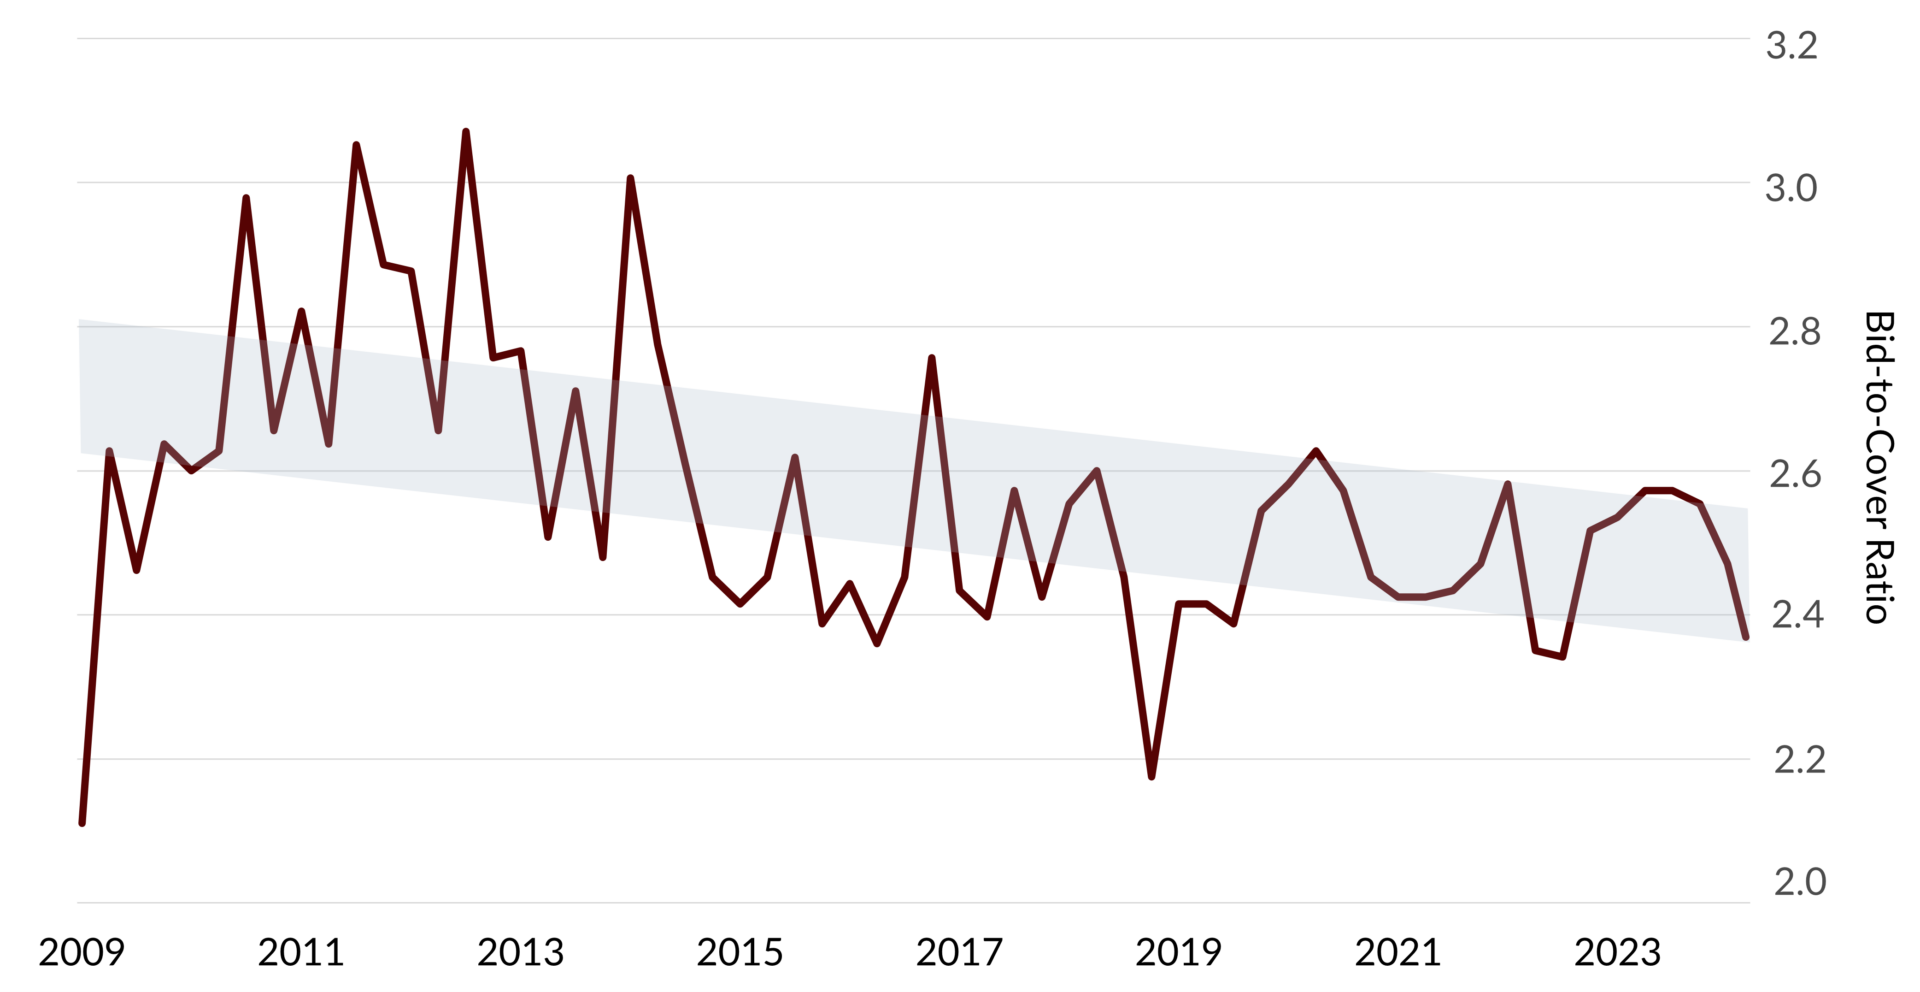
Despite the heady optimism of corporate earnings and positive returns in the stock market, one event near the end of May that went largely unnoticed by many deserves some scrutiny. On May 28, the United States Treasury sold 2-year and 5-year notes to fund the government. While the government sold the bonds it needed to sell, it was forced to sell them at a lower price (higher yield) than anticipated amid tepid demand. This demand is measured by the “bid-to-cover ratio.” This indicates the amount of demand at the auction in relation to the amount of treasury securities to be sold. On May 28, the bid-to-cover ratios for the 2-year and 5-year auctions were 2.41 and 2.3, respectively. These levels don’t mean anything on their own, but they were the lowest levels in several quarters and for 5-year notes were at the bottom end of a downward trend.
The Bid-to-Cover Ratio for 5-Year Notes Has Been Declining for 10 Years
Sources: U.S. Department of the Treasury, Bloomberg Finance, L.P.
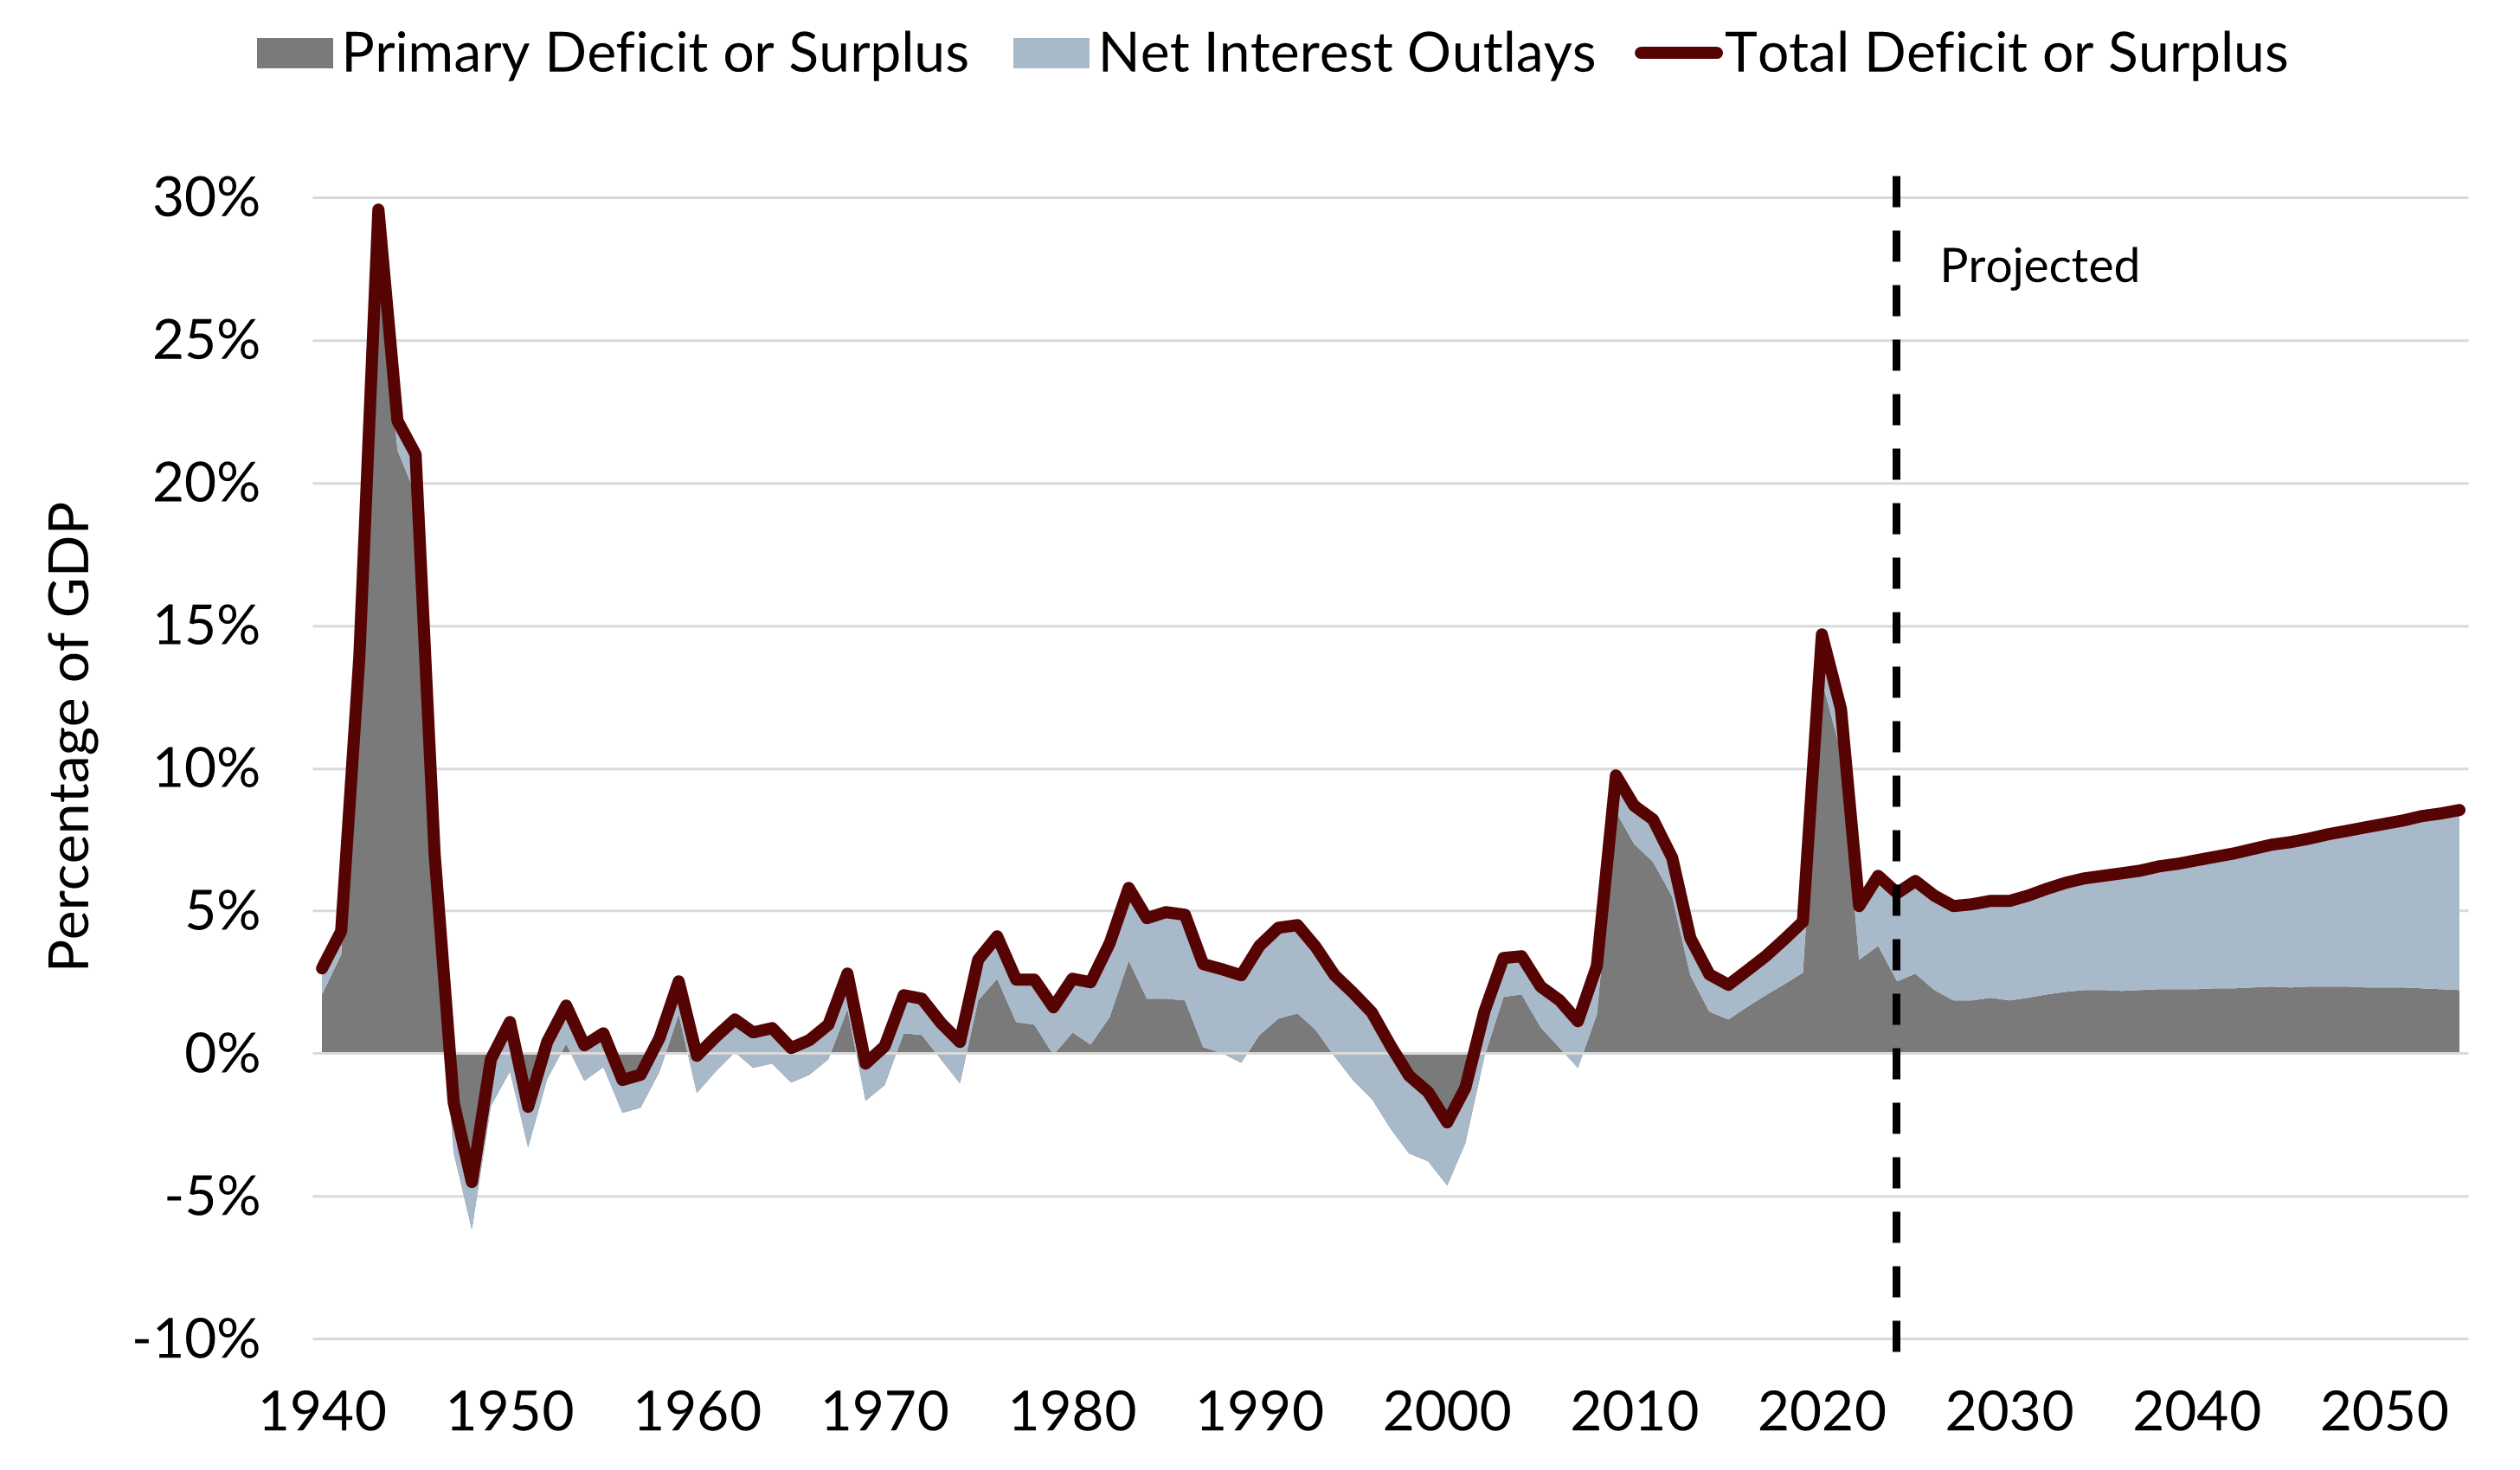
The downward trend showing generally weakening Treasury demand is paired with supply increases that are likely to move dramatically higher for the foreseeable future – at least according to the Congressional Budget Office. Supply may rise for several reasons, but they all boil down to larger fiscal deficits. These growing budget deficits have largely been predicted in the past to be primarily due to mandatory healthcare and social security spending. However, with interest rates at 5% and maintaining at that level or higher, interest on the existing debt may quickly become the number one driver of future deficits.
Total Deficits, Primary Deficits, and Net Interest Overlays
Sources: Congressional Budget Office
Like a person living paycheck to paycheck and borrowing on credit cards to finance an extravagant lifestyle, debt becomes a killer. As creditors find the borrower less creditworthy, the interest rate inevitably goes up. The hope is that this pain results in a behavior change where the borrower cuts expenditures and pays down the debt or refinances that debt to another lender. An individual can get away with shifting hundreds and even thousands of dollars of liabilities to other lenders or changing spending preferences. It is harder for the largest debtor in the world – the United States with $34.6 trillion in debt – to do the same. For the United States, changing our ways would require 435 House members, 100 Senators, and the President to be largely on the same page – a daunting ask in today’s political climate.
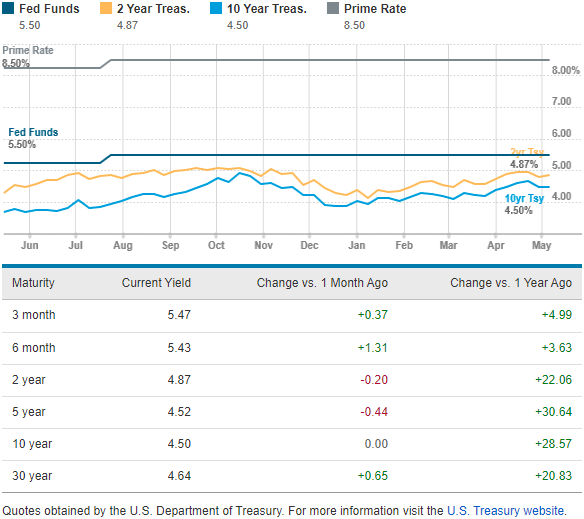
This isn’t to say that the United States faces an imminent default or that there is some immediate danger. There is still a healthy appetite for U.S. Treasury securities from foreigners, pension funds, insurance companies, and investment managers like Concord, who purchase Treasury securities for clients either directly or through ETFs. Also, soon enough, the Federal Reserve will no longer be a seller of Treasury securities as its “Quantitative Tightening” program will end. Finally, the world needs the ample liquidity only our Treasury market can provide to grease global capitalism.
The May 28 auctions might have been the canary in the coal mine, though. Investors like Concord are not willing to go very far out on the curve to buy long-dated Treasury debt when the forecasted supply-demand imbalance will almost certainly result in higher interest rates in the future. Primary dealers (institutions required to bid at auctions) are likely to bid up yields at auctions in the future to ensure that if they are forced to make concessions to sell in the secondary market, they still make a profit. Over time, this inching of up yields can continue until the borrower gets its fiscal house in order.
Which, of course, leads to the exciting (or dreadful, depending on your perspective) event that will occur at the end of June. On June 27, the first of two presidential debates will occur. The likelihood that questions about deficits and debt will come up is high. However, it is also likely that both candidates will promise not to touch one of the major drivers – entitlement spending. The ability to talk past a problem is something at which politicians excel. Investment managers entrusted with client dollars are not so lucky.
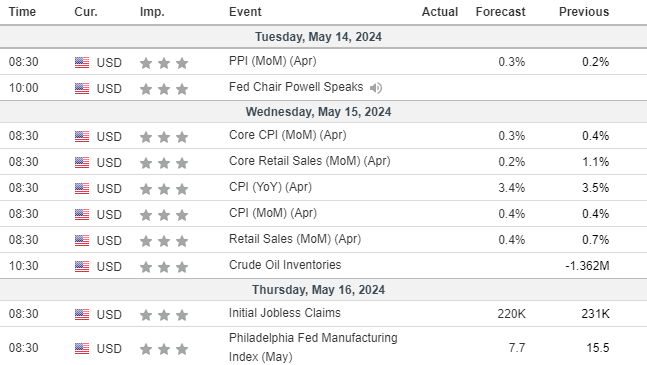
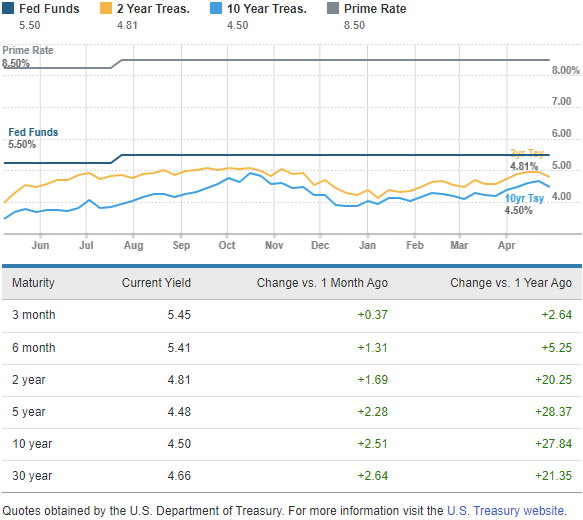
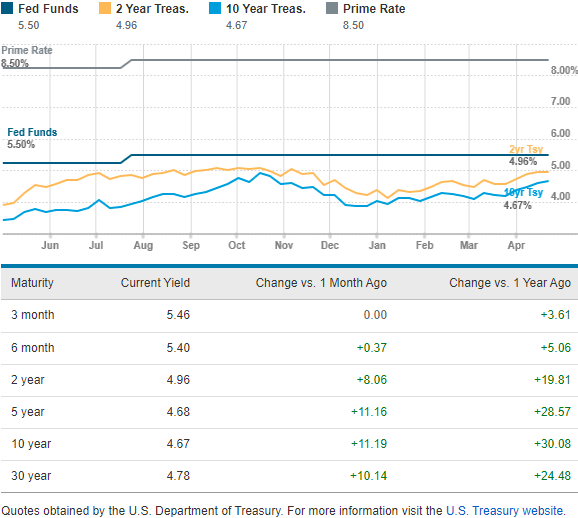
At Concord, we’ll be watching the next Treasury Note auctions on June 6th and 20th more carefully than the debate. We’ll also be watching for economic data as it rolls in to better understand how growth and inflation are changing. To the extent that data confirms our base case of economic growth continuing at a 2% pace and inflation remaining stagnant around 3%, 5% bond yields will become more accepted as not terribly restrictive for the U.S. economy. The economy, the average consumer, and the investor can enjoy life at a 5% interest rate. It’s the U.S. Treasury and long maturity bondholders that may feel the pain these higher interest rates bring.
Author

Gary Aiken, Chief Investment Officer
Gary Aiken is the Chief Investment Officer for Concord Asset Management and is responsible for macroeconomic analysis, asset allocation, and security selection, as well as trading and investment operations.
Gary has over 21 years of investment experience and holds an undergraduate degree in economics from the University of Maryland and an MBA from The George Washington University School of Business.
—
Disclosures: Please remember that past performance may not be indicative of future results. Different types of investments involve varying degrees of risk, and there can be no assurance that the future performance of any specific investment, investment strategy, or product (including the investments and/or investment strategies recommended or undertaken by Concord Asset Management, or any non-investment related content, made reference to directly or indirectly in this article will be profitable, equal any corresponding indicated historical performance level(s), be suitable for your portfolio or individual situation, or prove successful. Due to various factors, including changing market conditions and/or applicable laws, the content may no longer be reflective of current opinions or positions. Moreover, you should not assume that any discussion or information contained in this article serves as the receipt of, or as a substitute for, personalized investment advice from Concord Asset Management. To the extent that a reader has any questions regarding the applicability of any specific issue discussed above to his/her individual situation, he/she is encouraged to consult with the professional advisor of his/her choosing. Concord Asset Management is neither a law firm, nor a certified public accounting firm, and no portion of this content should be construed as legal or accounting advice. A copy of Concord Asset Management’ current written disclosure Brochure discussing our advisory services and fees is available upon request or at https://concordassetmgmt.com/. Please Note: If you are a Concord Asset Management or Concord Wealth Partners client, please remember to contact the firm in writing, if there are any changes in your personal/financial situation or investment objectives for the purpose of reviewing, evaluating, and/or revising our previous recommendations and/or services, or if you would like to impose, add, or to modify any reasonable restrictions to our investment advisory services. Concord Asset Management and Concord Wealth Partners shall continue to rely on the accuracy of information that you have provided. Please Note: If you are a Concord Asset Management or Concord Wealth Partners client, please advise us if you have not been receiving account statements (at least quarterly) from the account custodian.

