By Gary Aiken | April 4, 2023
- Quarterly data showed earnings declining, economic growth slowing, and inflation cooling in alignment with the Federal Reserve’s policy goals.
- Stock and bond markets fluctuated within a range during Q1 as market participants grappled with competing data showing the potential for avoiding a recession colliding with bank failures.
- Global financial assets seem fairly valued given expectations for growth and inflation. Risks remain skewed to the downside as central banks continue to tighten monetary policy.
Economic Commentary: According to Plan
One year ago, the Federal Reserve embarked upon its current mission to return inflation to its 2% target. The Federal Reserve removes money from the economy by selling government bonds. These actions include selling short-term government bonds, which raise short-term interest rates (Fed Funds), and selling holdings of longer-term government bonds (quantitative tightening). Removing excess money from the system should quell inflation under the simplified definition of too much money chasing too few goods.
After the first year of these actions, it seems to be working. The year-over-year headline inflation rate, as measured by the Consumer Price Index for All Urban Consumers (CPI-U,) declined from its peak in June 2022 of 9.1% to 6.0% as of February 2023 (the latest data we have before publication). The slowdown in the pace of inflation is easier to notice when looking at the following chart showing the CPI level. Since the peak of the annual inflation rate, inflation has slowed to an annualized pace of 2.3%, which is close to the Fed’s target.
Inflation Index Level
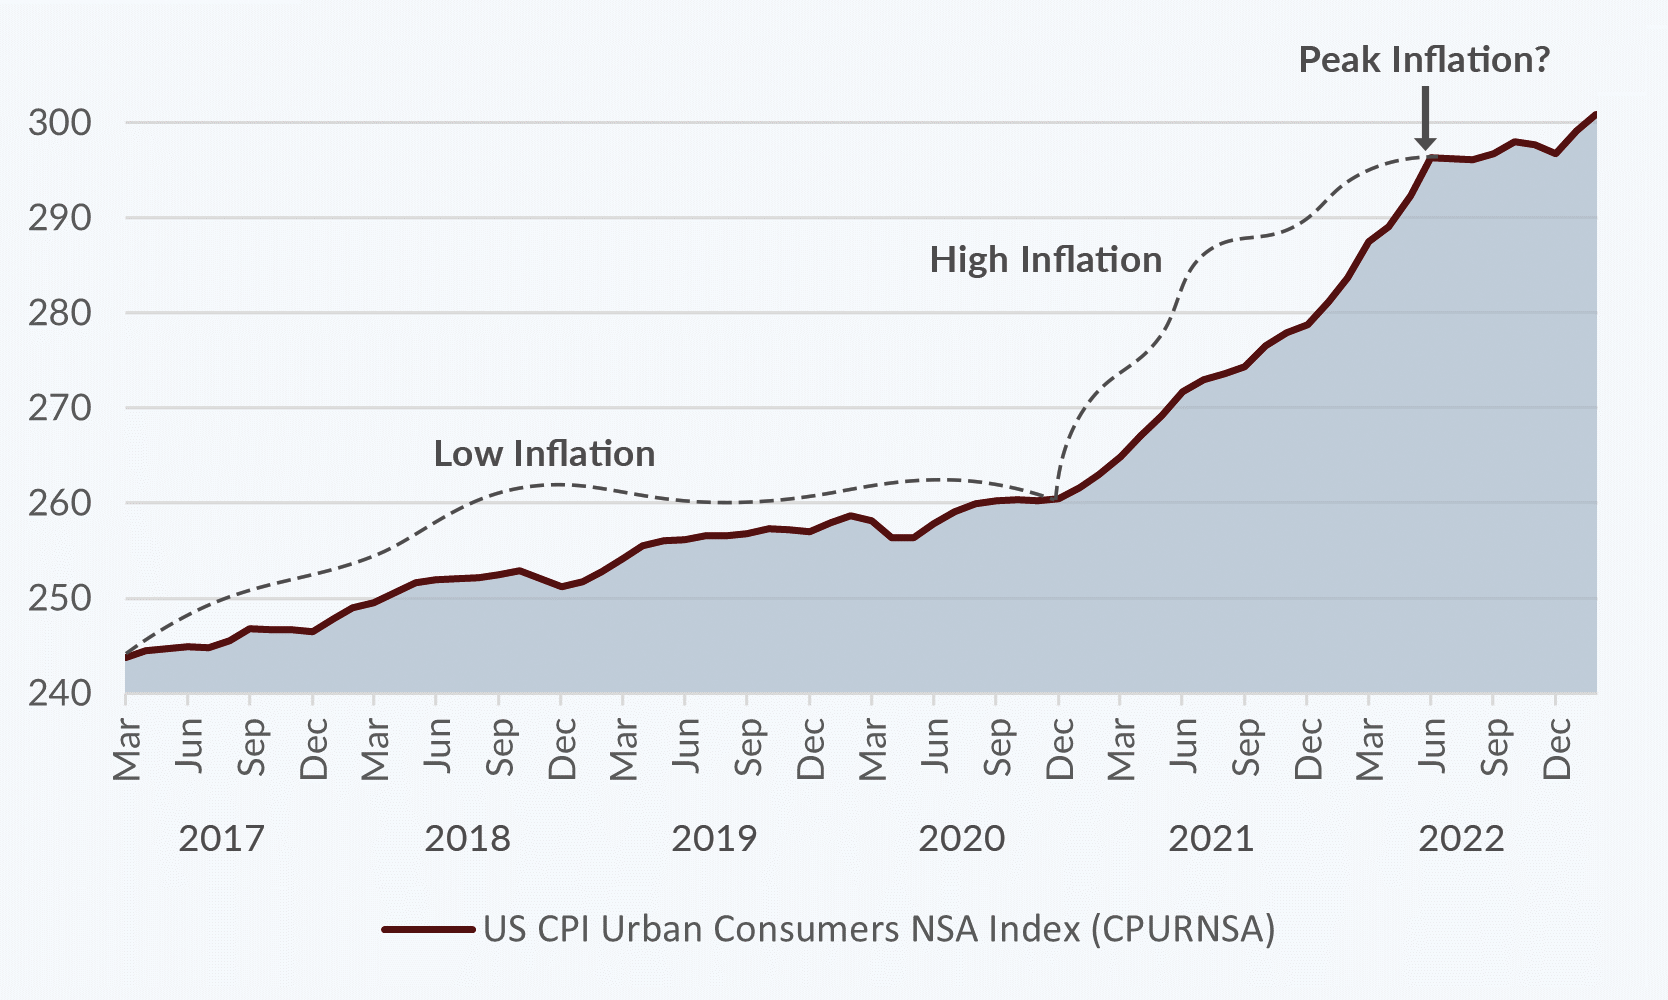
Source: Bloomberg Finance L.P.
The Fed has achieved this slowdown through what can only be described as aggressive actions. In the past forty years, the Fed has never increased the Fed Funds target rate by 475 basis points in any tightening cycle except for the current one. While tightening cycles of the late 1970s and early 1980s had larger absolute moves in the Fed Funds target rate, this is the first tightening cycle since 1959 to include an actual year-over-year decline in money supply. So, no Gen-X investor like me has ever experienced anything like this. No Boomer investors like my mentors have ever experienced anything like this. As the Chinese Proverb says, may you live in interesting times!
The U.S. is not the only place experiencing inflation. Eurozone inflation was 8.5% for February as measured by the Euro Area MUICP All Items year-over-year NSA. Again, the year-over-year picture doesn’t show the work of the central banks’ tightening efforts. The European Central Bank raised its main policy rate by 50 basis points in March to 3.5%. While hiking rates like the U.S., Eurozone M2 money supply has grown by 3% as opposed to money supply declines in the U.S. The EU inflation rate since June has slowed to a 3.9% annual pace; still elevated, but showing progress.
Japan, which has desired some inflation to fight a decades-old deflation, had a 4.3% inflation rate as of its January calculation, but its policy rate stands at –0.1% (that’s correct, negative yields still rule Japan even with 4% plus inflation!). This is to say that even with other central banks taking aggressive actions of their own, the U.S. Federal Reserve, under the leadership of Jerome Powell, is taking no prisoners and successfully slowing the pace of inflation.
Federal Reserve Fed Funds Target Rate Hiking Cycles
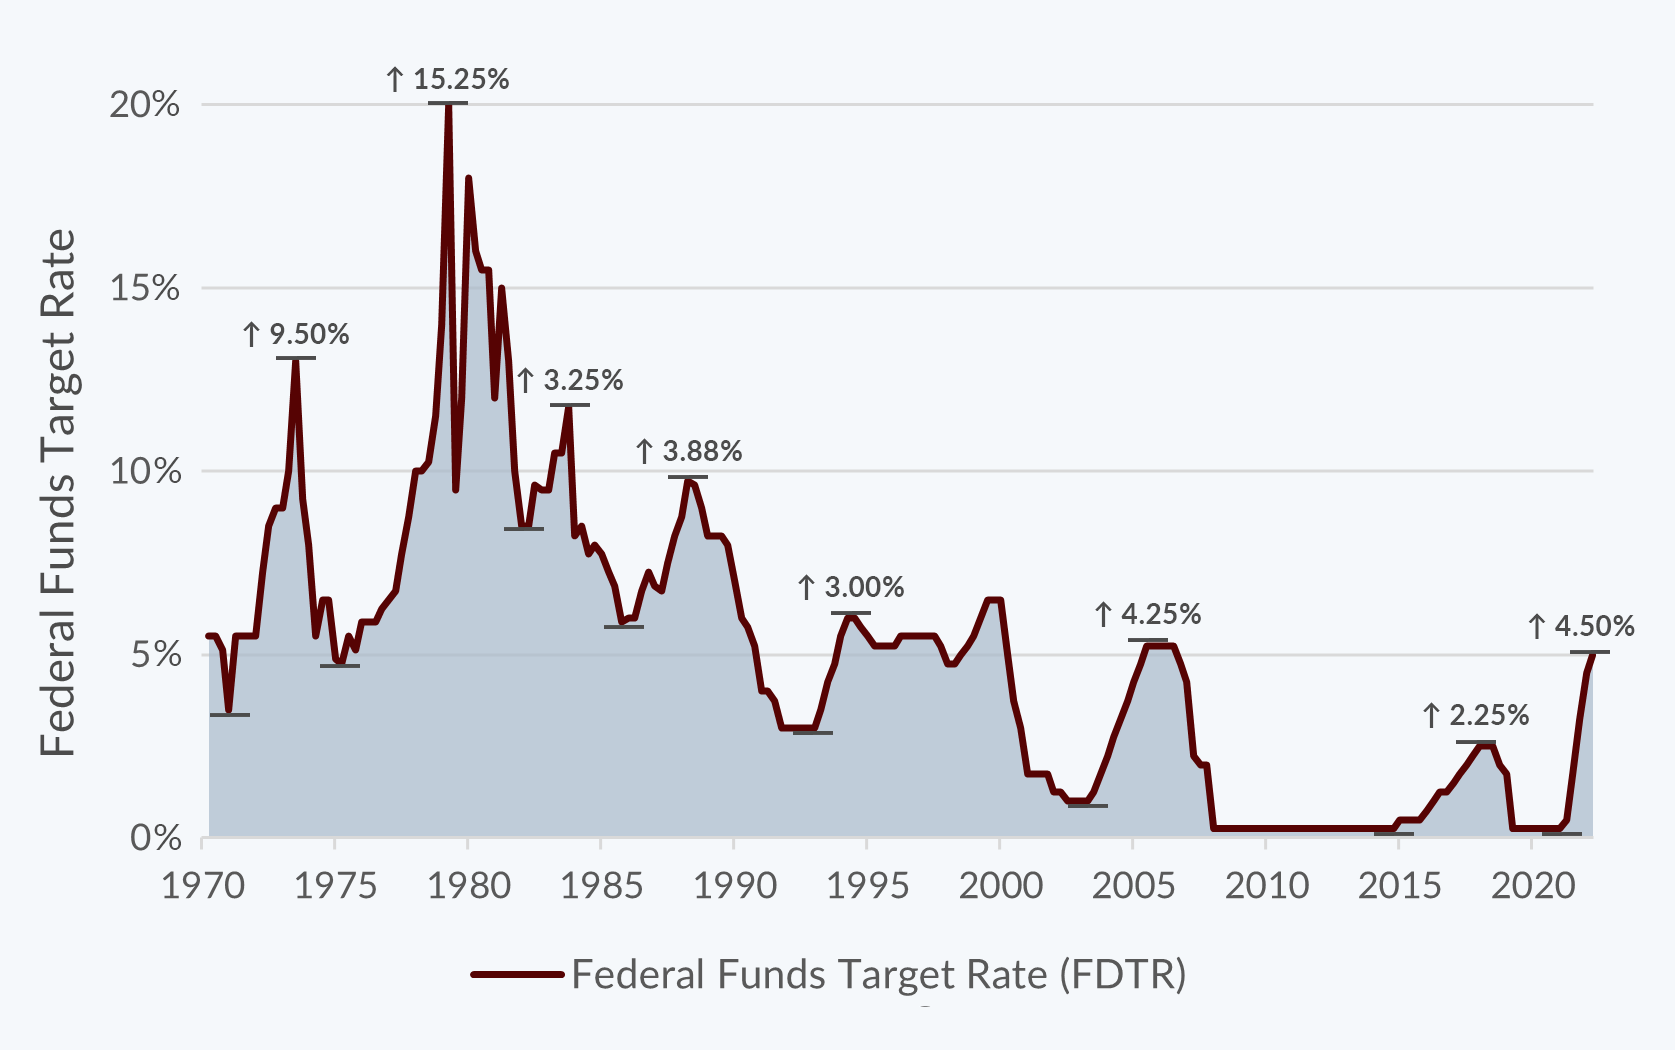
Source: Bloomberg Finance L.P.
This success is not without cost. The Federal Reserve expects growth to slow. They expect the unemployment rate to go up. They don’t anticipate a recession, but do not rule it out. Importantly, they repeatedly say that the Federal Reserve prefers lower growth, higher unemployment, and even a mild recession to sustained inflation. This policy choice comes to a head in press conferences and Q&As, but none so visceral as the interaction on Capitol Hill between Senator Elizabeth Warren and Chairman Powell:1
Senator Warren: “Well, but it is [the number of job losses the Fed expects may result from a 1% increase in the unemployment rate], and it’s in your report, and that would be about two million people who would lose their jobs. People who are working right now making their mortgages. So, Chair Powell, if you could speak directly to the two million hard-working people who have decent jobs today, who you’re planning to get fired over the next year, what would you say to them? How would you explain your view that they need to lose their jobs?”
Chair Powell: “I would explain to people more broadly that inflation is extremely high and it’s hurting the working people of this country badly, all of them. Not just two million of them but all of them are suffering under high inflation, and we are taking the only measures we have to bring inflation down.”
Senator Warren: “And putting two million out of work is just part of the cost, and they just have to bear it?”
Chair Powell: “Well, will working people be better off if we just walk away from our jobs and inflation remains five percent, six percent?”
Up until the failure of Silicon Valley Bank in mid-March, the economic picture looked reasonably positive. The unemployment rate remained low for the first quarter, with average weekly jobless claims under two hundred thousand and continuing claims averaging less than 1.7 million. Real average hourly earnings were still negative (declining purchasing power) but showed some improvement. Remarkably, in the face of a slowing economy, the labor force participation rate increased to 62.5% while the unemployment rate declined to 3.4%. Retail sales and inventories were generally flat during the first quarter, as were industrial production and goods orders as the services sector continued to grow.
Corporate balance sheets look to be in good shape. The average “current ratio” (short-term assets/short-term liabilities) for large U.S. companies was approximately 1.25, and the size of total debt at about 25% of total assets. However, the effects of Chairman Powell’s desired slowdown began to show in the earnings data, in forward guidance from companies, and finally in announcements of layoffs. S&P 500 Q1 2023 corporate profitability declined by approximately 2.4% year-over-year. Large U.S. companies saw their gross margins and profit margins decline below their 10-year quarterly averages in Q4 2022 and Q1 2023.
It is important to note that this dichotomy of declining corporate prospects and seemingly stable consumer/employment data are best explained by the phrase “long and variable lags.” It takes time for monetary policy to work its way through the system. It takes time for the perverse incentive of high short-term rates to convince spenders to save and investors to sit on their hands, but eventually, it works. By my measure of rolling inflation since the June peak, I’d be so daring as to claim it is working. It’s quite possible that by the time we get to mid-2023, those year-over-year inflation comparisons will drop dramatically from 6% to something resembling the Fed’s stated target range.
The conundrum for the Federal Reserve is whether they should stop raising rates now and let the natural progression of long and variable lags work their way through the system, or continue pursuing their stated goal until they see the whites of inflation’s eyes. If the Fed stopped now, they could risk inflation surging again and having to restart the tightening process. This starting and stopping partly led to the stagflation of the 1970s. On a less gloomy outlook, if they have done enough and stopped now, it might still be possible to have a soft landing. Our view is that they have done enough, and the data should tell them to stop sooner rather than later.
Market Commentary: Great Financial Crisis PTSD
The academic debate amongst economists translates into a tug-of-war between the bulls and bears in the financial markets. The stock and bond markets bounced between FOMO (fear of missing out) and PTSD (post-traumatic stress disorder) during the first quarter.
A Range Bound Stock Market
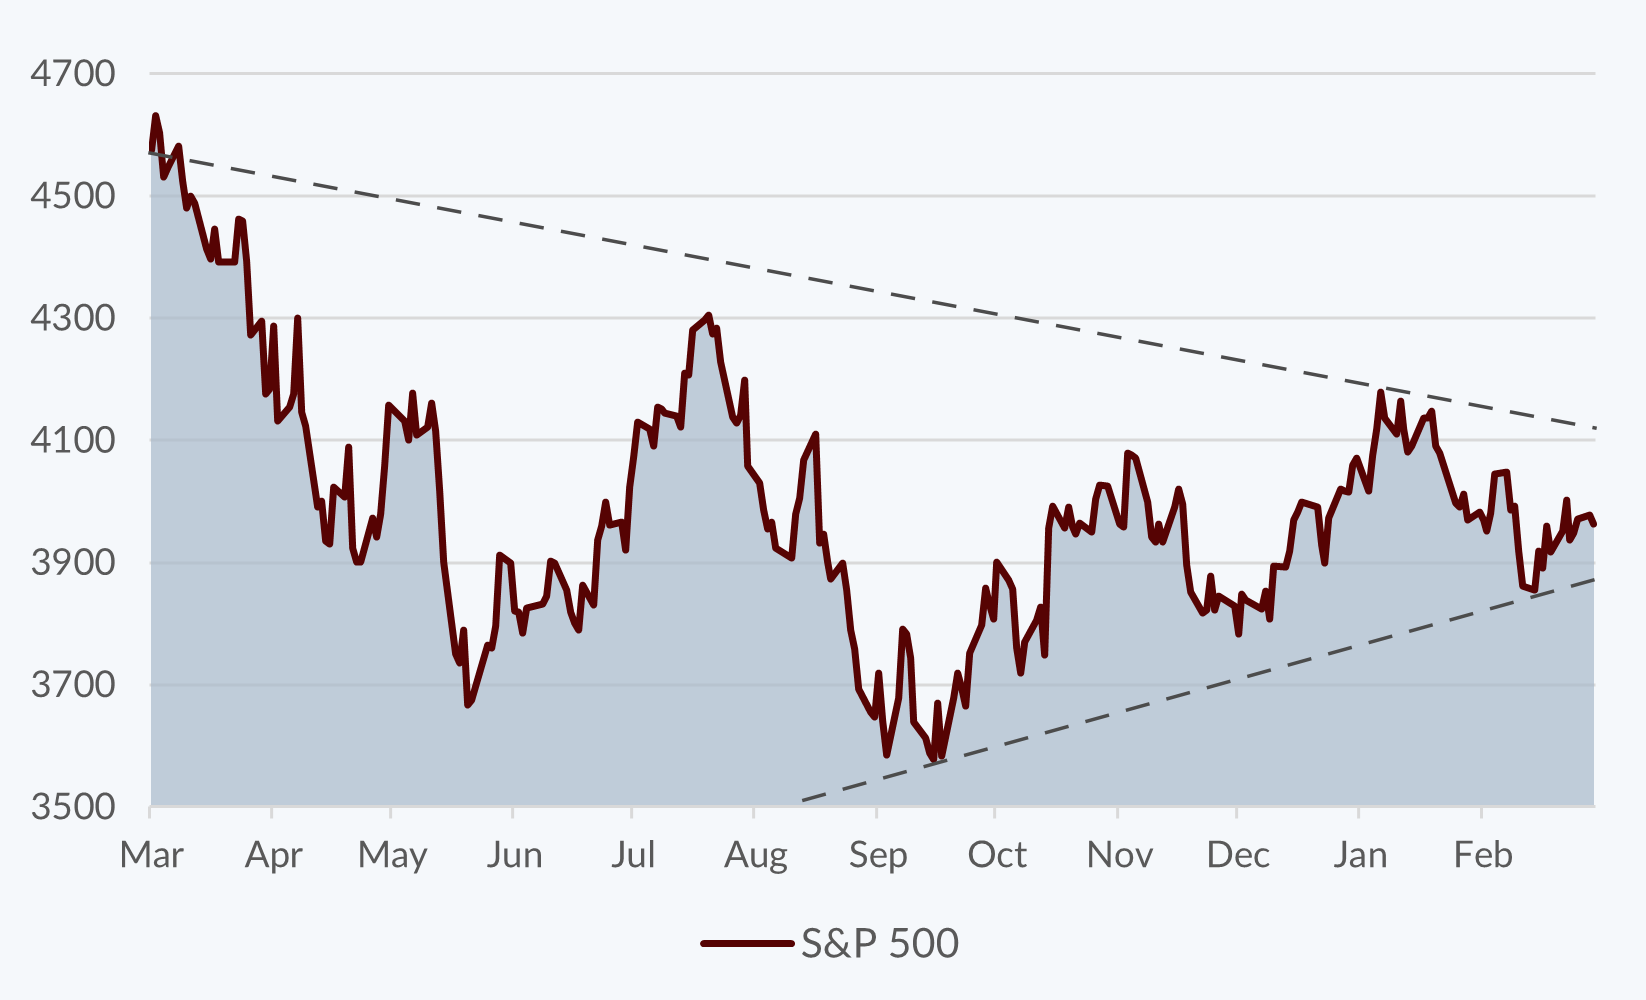
Source: Bloomberg Finance L.P.
The chart above shows the S&P 500 bouncing in a range since the June lows — right when inflation started to peak. We seem to have a clear direction — sideways. When I find myself in times of uncertainty, I ask questions. What was I worried about? Where do the facts stand now? What does history tell us about similar situations?
The expected impact on valuations from rising interest rates has played out. With respect to the situation at regional banks, the Federal Reserve, FDIC, and Treasury seem to have found a temporary solution to provide liquidity to banks that made errors in investments even as the Fed was delineating the direction of interest rates for all to see. Only time will tell if depositors continue to pull money from banks, but my view is that small and medium-sized banks serve an important purpose — providing customer service at a local level that large banks just cannot afford to provide. Financial companies are prone to asset/liability mismatches and liquidity crises, so could an insurance company or two be in crisis? Perhaps, but I believe it would likely be idiosyncratic — not systemic.
For all the overwrought comparisons to the Great Financial Crisis, residential real estate does not seem as problematic this time. Just the opposite, the system is overwhelmed with borrowers who will never sell because they locked in historically low interest rates and monthly payments. Yes, the refinance market will be light, and mortgage banking business profitability will likely be lower. We’ll factor that into our view on allocations to banks, but home demand remains strong and neither homebuilders nor their financiers engaged in the crazy land speculation that went on in 2005-06. The commercial real estate market may have some issues related to valuation upon refinance and the change in occupancy trends following work-from-home shifts. As always, geography and property type matter, but there has not been overbuilding or oversupply. Smart building owners will convert to residential or find other uses, and lenders generally are stingy in their underwriting leading to low loan-to-value ratios and safe collateral.
On the global stage, we were worried about the prices of commodities and the reopening of China. The price of oil has returned near to its pre-pandemic level thanks to slowdowns in ex-China demand, the availability of cheap Russian oil to China, and the near replacement of global rig count. Even the Biden administration seems to have turned a corner, allowing new drilling in Alaska. The chart below shows the price of oil and the global oil rig count. The horizontal line is the Biden administration’s $70 price, below which they said they would be comfortable buying oil to replenish the Strategic Petroleum Reserve. The fears of a dislocation in commodities may therefore be overblown.
Oil Market Equilibrium?
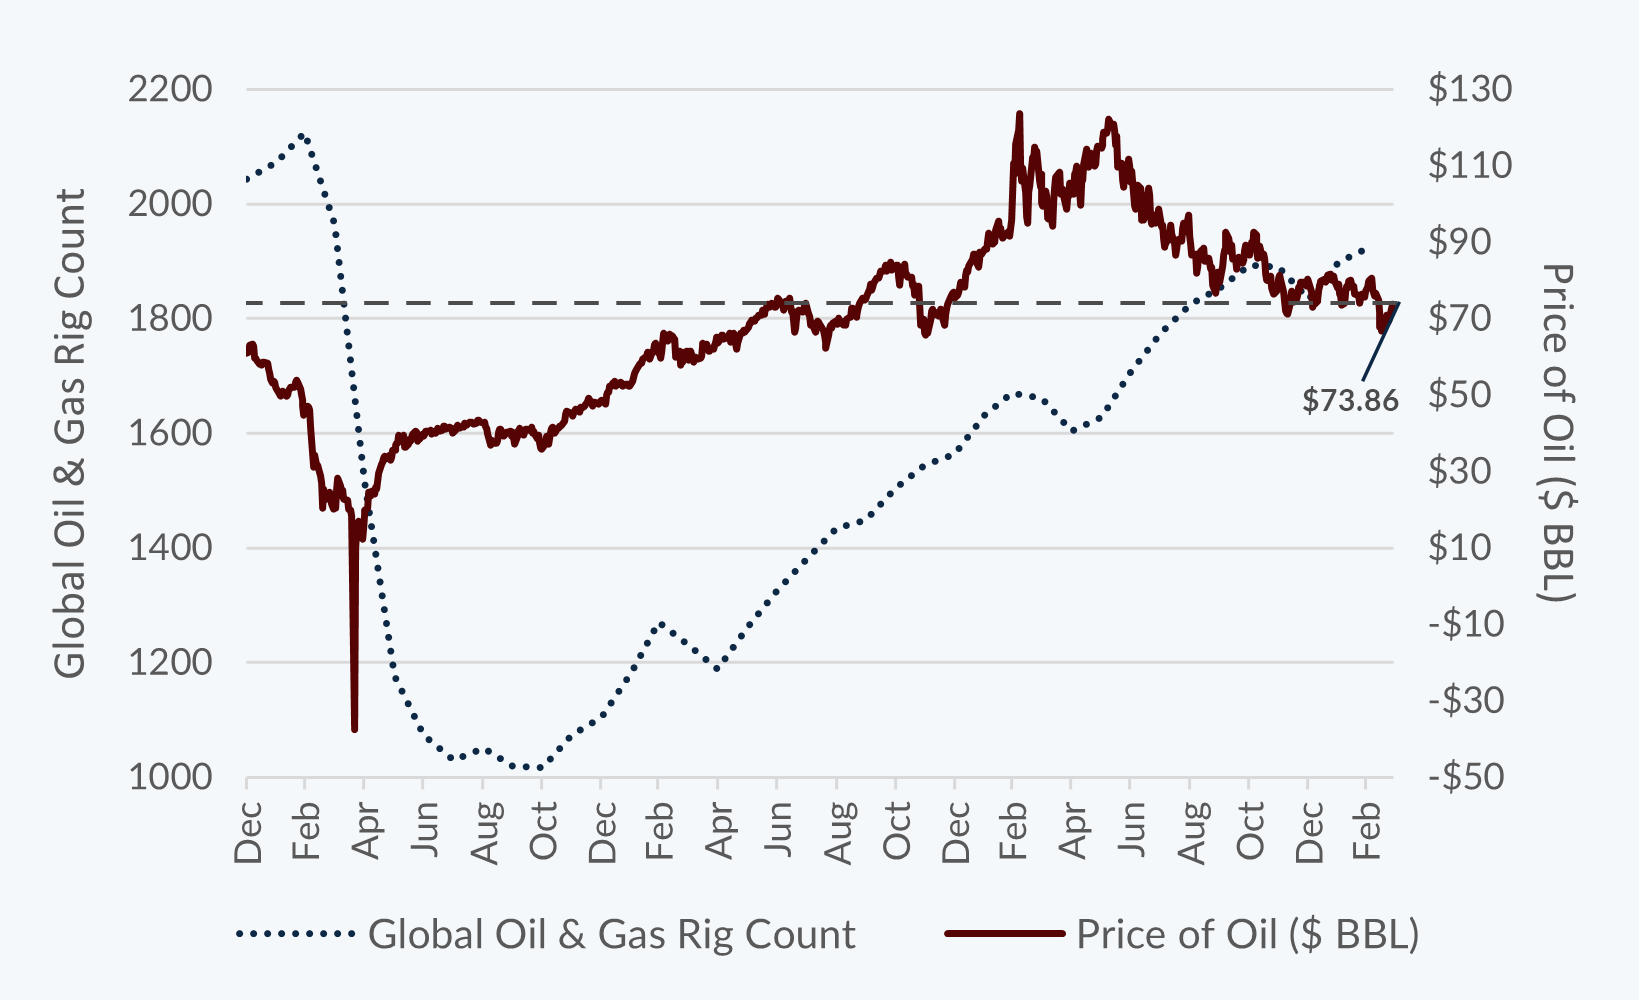
Source: Bloomberg Finance L.P.
The War in Ukraine may continue indefinitely, but the fear of commodity dislocation seems to be fading one year later. Markets are great at putting buyers and sellers together at the right price. For Corn, Wheat, and Soybeans, that price is basically the same as before the War started. The Bloomberg Commodities Index is 5.5% lower than it was on February 15, 2022, before the War started. So, we could now argue that the global slowdown in demand and the opening of the world post-COVID took out the inefficiencies from lockdowns.
As for Emerging Markets (EM), while China may be able to get cheap oil from Russia, their demand for other natural resources is still to be found in EM. We believe Chinese tourists and trade will be beneficial to EM economies this year — complementing any boost from U.S. tourism and trade. Even so, Emerging Markets are not independent of the slowdown in demand from the U.S. and Europe. Further, these countries are maturing, and as countries mature, their growth rates naturally slow. For the December 2022 quarter, EM GDP grew at a 2.78% real rate. This seems slow in a world where we thought that EM economies ought to grow between 5% and 6%; however, when drawing a trendline from 2007 to the present, we can see that that rate is in line with the long-term trend of lower growth rates even in Emerging Markets.
But I sense you asking nervously; a worst-case scenario is still on the table, isn’t it? Here is where I turn to history. The Fed generally hasn’t stopped hiking until something finally breaks, as we’re seeing now in the financial sector. Maybe that’s the harbinger of the recession that has been Concord’s base case for 2023. By the time something breaks, usually, it’s not just one thing that’s broken. Lots of things get broken and need to be fixed. The bond market seems to indicate that the Federal Reserve has already gone too far, and it hasn’t shown up yet in the economic data or corporate performance.
If the Fed has indeed gone too far and the next step is a pause or a cut, what does that mean for stock markets? Since 1972, the Federal Reserve has had eight major tightening cycles. The following chart shows the end of a rate cycle, the maximum drawdown in the S&P 500, and the returns for the index six and twelve months later:
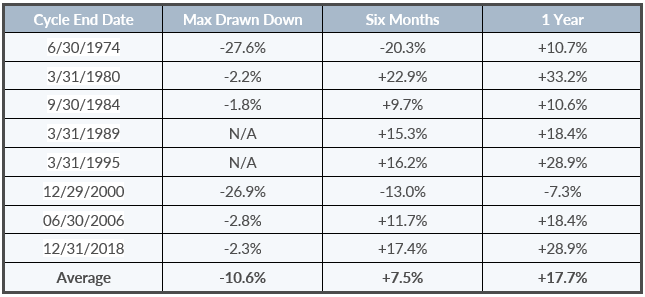
Source: Bloomberg Finance L.P.
While none of these scenarios exactly match where we are today, we can see that the fearmongering on Twitter about how when the Fed finishes hiking, that means it’s too late and all is lost — is hyperbole. Ultimately, there’s the chance that the Federal Reserve has lucked into a scenario where they have done their job appropriately.
Final Thoughts: Resetting Our Expectations
In December 2021, the Fed announced that they would finally be letting go of the zero bound and quantitative easing. The endpoint of the subsequent volatility we’ve experienced is our arrival at some new equilibrium. So, the natural questions are: What does equilibrium look like, and as the kids in the back seat on a road trip might ask, “are we there yet?” In economics, this equilibrium is defined by R* (“R-star”) or the natural rate of growth in the economy.
Pre-pandemic, the natural growth rate for the U.S. Economy was between 2% and 3%. Going forward, given structural issues like a lack of immigration and an increasingly burdensome debt level, it seems like a natural growth rate for the U.S. economy might be a slower 1 to 2%. If inflation has returned to its pre-pandemic growth rate of between 2 and 3%, then expected long-term interest rates — like the 10-year U.S. Treasury Note — should yield between 3% and 5%.
So, where were we in Q1 2023 versus this reset expectation? Treasury Inflation Protected Securities real yields for the 10-year note ended the quarter at 1.3% and an implied inflation rate of 2.3% against the backdrop of a 10-year nominal U.S. Treasury note at 3.6%. Check.
BBB Credit Spreads vs. Historical Average
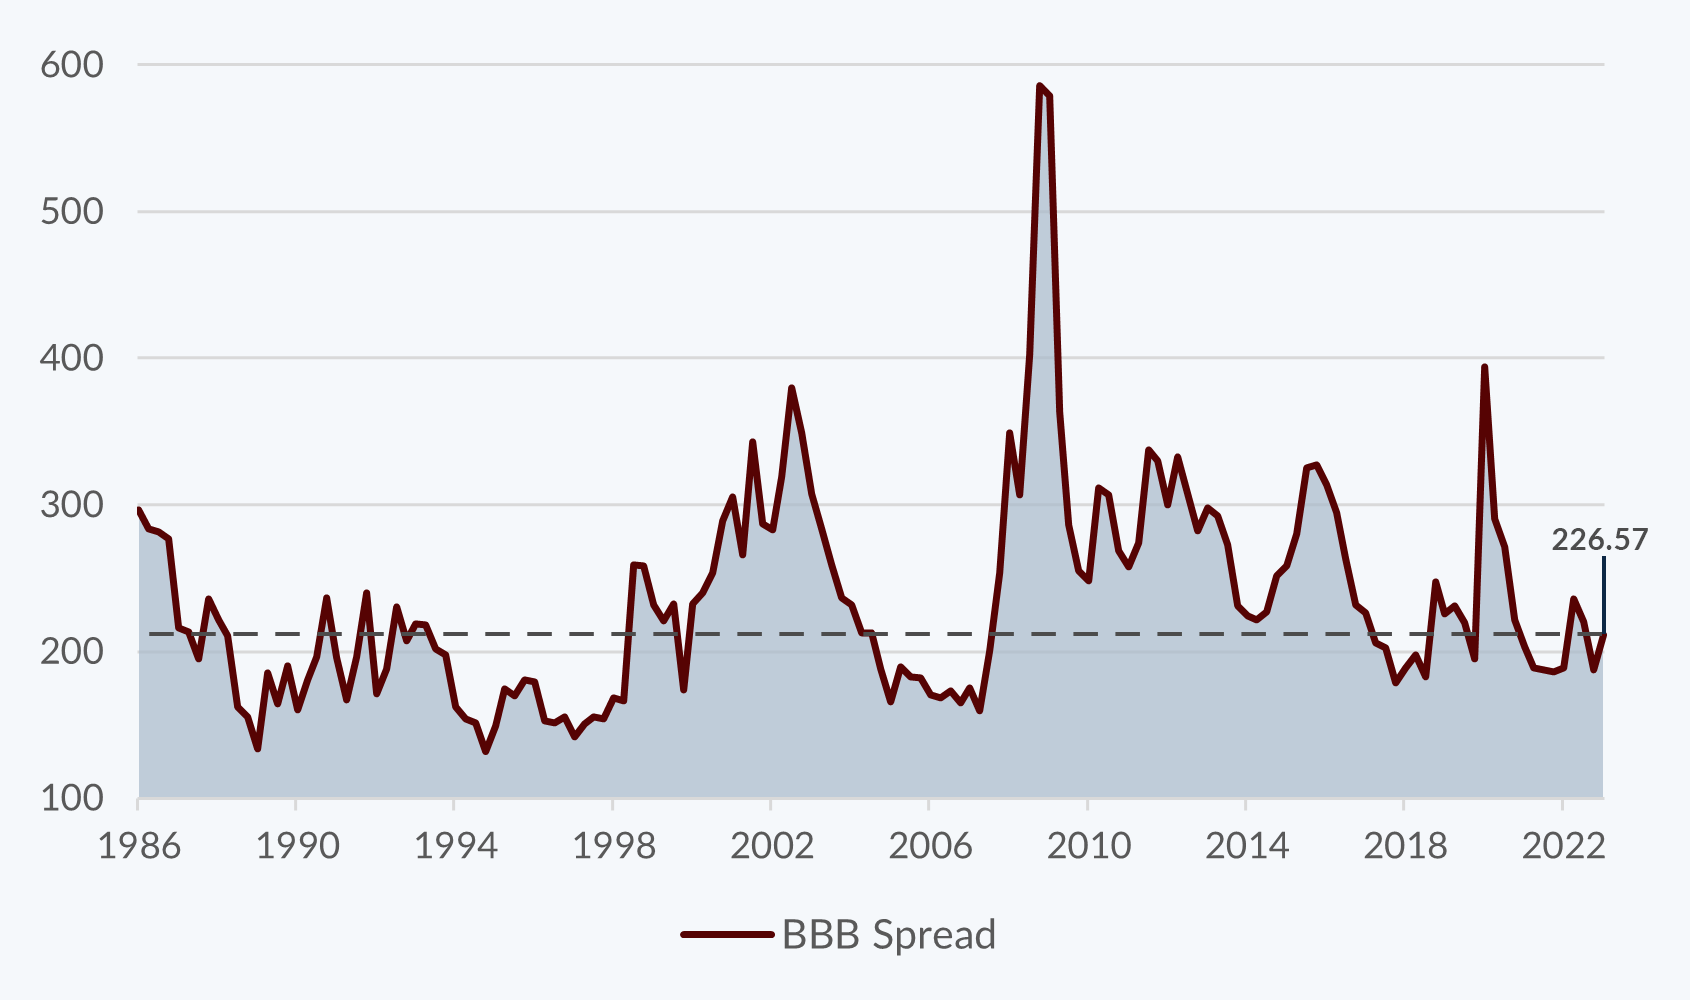
Source: Bloomberg Finance L.P.
What about other types of bonds? The difference between a bond’s yield and the equivalent government bond is called a spread. The spread describes how much compensation an investor should receive for taking on the credit risk inherent in lending money to a company. On average, companies rated BBB (the bottom rung of investment grade) have had a spread of approximately 235 basis points (a basis point is 1/100th of a percent). At the end of Q1, the 10-year BBB spread is 227 basis points. Check.
What about less credit-worthy borrowers, like those who issue Junk Bonds? On average, companies rated below BBB have yielded a spread for investors of approximately 507 basis points. At the end of Q1, that spread is 555 basis points. Check.
So, the bond market seems to reflect fair value. What about stocks? Assuming a long-term, risk-free rate of 3.6%, a 1.8% dividend yield, and a long-term return of 10.8%, large cap stocks ought to have a reasonable P/E in that environment of approximately 19x. At the end of Q1, with declining earnings and rising prices, the S&P 500 P/E ratio is approximately 19x. Check.
Earnings for the S&P 500 declined year-over-year falling approximately 2.4% for Q1 2023 compared to Q1 2022. This shows the resilience of American companies. Inflation, adjusting to a post-pandemic recovery, and War have not significantly compromised profits. Gross margins in Q1 2023 were at roughly 34.6%, versus an average of 35.6% for all of 2022. Profit (net income) margins were 12.7% versus 13.3% for all of 2022.
American companies are not the only ones seeing resilience in the face of hardship. While companies outside the U.S. have a lower return on equity, their valuation metrics reflect fair value as well. The P/E multiple for stocks in the MSCI ACWI (All Country World Index) – ex U.S. increased from 11.5x in Q1 2022 to 12.6x in Q1 2023. Their 32% gross margins are competitive to those of U.S. companies, as are their profit margins of roughly 13%. So, a check mark for the general reasonableness of equity valuations across the world.
Unfortunately, even if we are at longer-term equilibrium with respect to valuations, markets don’t stay there very long. From our vantage point, while many excesses have been wrung out of the system, the pendulum momentum is likely still swinging to the downside.
Downside risks come from the aggressive Federal Reserve actions to quell inflation as the effects of an inverted yield curve (when short-term rates are higher than long-term rates) filter through the economy. Companies are hiring less and spending less on new projects as they strive to limit earnings declines and margin compression. A split Congress with a looming debt ceiling limit likely means that government spending growth will be curtailed, limiting U.S. growth expectations. The relaxation of pandemic responses, including the reinstatement of student loan repayments, will put stress on retail and services income as borrowers must start diverting cash to make payments that were on hold for three years. Alternative assets like real estate have not been fully repriced to the market. To the extent that forced sellers set market prices, there may be market participants who will record losses even if they are not selling those assets. Thus, our base case remains a recession at some point during 2023.
We remain focused on limiting volatility in portfolios and focusing on companies at reasonable valuations who can sustain profitability even in difficult economic circumstances. A range-bound bond and stock market may mean that some investors’ emotions will float between FOMO and PTSD. The wise investor will continue to put money to work as opportunities present themselves. We strive to count ourselves among them.
Author

Gary Aiken, Chief Investment Officer
Gary Aiken is the Chief Investment Officer for Concord Asset Management and is responsible for macroeconomic analysis, asset allocation, and security selection as well as trading and investment operations.
Gary has over 21 years of investment experience and holds an undergraduate degree in economics from the University of Maryland and an MBA from The George Washington University School of Business.
—
Footnotes and Sources:
1Transcript: The Semiannual Monetary Policy Report to the Congress U.S. Senate Committee on Banking, Housing, and Urban Affairs Subcommittee on Economic Policy. Tuesday, March 7, 2023.
Investing involves risks, and investment decisions should be based on your own goals, time horizon, and tolerance for risk. The return and principal value of investments will fluctuate as market conditions change. When sold, investments may be worth more or less than their original cost. The forecasts or forward-looking statements are based on assumptions, may not materialize, and are subject to revision without notice. The market indexes discussed are unmanaged, and generally, considered representative of their respective markets. Index performance is not indicative of the past performance of a particular investment. Indexes do not incur management fees, costs, and expenses. Individuals cannot directly invest in unmanaged indexes. Past performance does not guarantee future results. The Dow Jones Industrial Average is an unmanaged index that is generally considered representative of large-capitalization companies on the U.S. stock market. Nasdaq Composite is an index of the common stocks and similar securities listed on the NASDAQ stock market and is considered a broad indicator of the performance of technology and growth companies. The MSCI EAFE Index was created by Morgan Stanley Capital International (MSCI) serves as a benchmark of the performance of major international equity markets, as represented by 21 major MSCI indexes from Europe, Australia, and Southeast Asia. The S&P 500 Composite Index is an unmanaged group of securities that are considered to be representative of the stock market in general. U.S. Treasury Notes are guaranteed by the federal government as to the timely payment of principal and interest. However, if you sell a Treasury Note prior to maturity, it may be worth more or less than the original price paid. Fixed income investments are subject to various risks including changes in interest rates, credit quality, inflation risk, market valuations, prepayments, corporate events, tax ramifications, and other factors. International investments carry additional risks, which include differences in financial reporting standards, currency exchange rates, political risks unique to a specific country, foreign taxes and regulations, and the potential for illiquid markets. These factors may result in greater share price volatility. Please consult your financial professional for additional information. This content is developed from sources believed to be providing accurate information. The information in this material is not intended as tax or legal advice. Please consult legal or tax professionals for specific information regarding your individual situation. The opinions expressed and material provided are for general information, and they should not be considered a solicitation for the purchase or sale of any security.
Concord Asset Management, LLC (“CAM” or “IA Firm”) is a registered investment advisor with the Securities and Exchange Commission. CAM is affiliated, and shares advisory personnel, with Concord Wealth Partners. CAM offers advisory services, including customized sub-advisory solutions, to other registered investment advisers and/or institutional managers, including its affiliate, Concord Wealth Partners, LLC. CAM’s investment advisory services are only offered to current or prospective clients where CAM and its investment adviser representatives are properly licensed or exempt from licensure.
The information provided in this commentary is for educational and informational purposes only and does not constitute investment advice and it should not be relied on as such. It should not be considered a solicitation to buy or an offer to sell a security. It does not take into account any investor’s particular investment objectives, strategies, tax status, or investment horizon. You should consult your attorney or tax advisor.
The views expressed in this commentary are subject to change based on the market and other conditions. These documents may contain certain statements that may be deemed forward‐looking statements. Please note that any such statements are not guarantees of any future performance and actual results or developments may differ materially from those projected. Any projections, market outlooks, or estimates are based upon certain assumptions and should not be construed as indicative of actual events that will occur.
Please remember that past performance may not be indicative of future results. Different types of investments involve varying degrees of risk, and there can be no assurance that the future performance of any specific investment, investment strategy, or product (including the investments and/or investment strategies recommended or undertaken by CAM or its affiliates, or any non-investment related content, made reference to directly or indirectly in this newsletter will be profitable, equal any corresponding indicated historical performance level(s), be suitable for your portfolio or individual situation or prove successful. Due to various factors, including changing market conditions and/or applicable laws, the content may no longer be reflective of current opinions or positions. Moreover, you should not assume that any discussion or information contained in this newsletter serves as the receipt of, or as a substitute for, personalized investment advice from CAM or CWP. To the extent that a reader has any questions regarding the applicability of any specific issue discussed above to his/her individual situation, he/she is encouraged to consult with the professional advisor of his/her choosing. IA Firm is neither a law firm, nor a certified public accounting firm, and no portion of the newsletter content should be construed as legal or accounting advice. A copy of IA Firm’s current written disclosure Brochure discussing our advisory services and fees is available upon request or at https://concordassetmgmt.com/.
Please Note: If you are an IA Firm client, please remember to contact IA Firm, in writing, if there are any changes in your personal/financial situation or investment objectives for the purpose of reviewing/evaluating/revising our previous recommendations and/or services, or if you would like to impose, add, or to modify any reasonable restrictions to our investment advisory services. IA Firm shall continue to rely on the accuracy of the information that you have provided.
Please Note: If you are an IA Firm client, please advise us if you have not been receiving account statements (at least quarterly) from the account custodian.